
Help Center / Dashboard
Your dashboard
Role-based KPI boards: switch personas, set the period, filter, and drill into any number. · 6 min read
The board and your personas#
The dashboard is a set of KPI tiles chosen for your role in the firm: Principal, CFO, Project Manager, Studio Leader, or Architect / Engineer. Each persona gets its own board, so a CFO opens to cash and AR while a Project Manager opens to their projects' health.
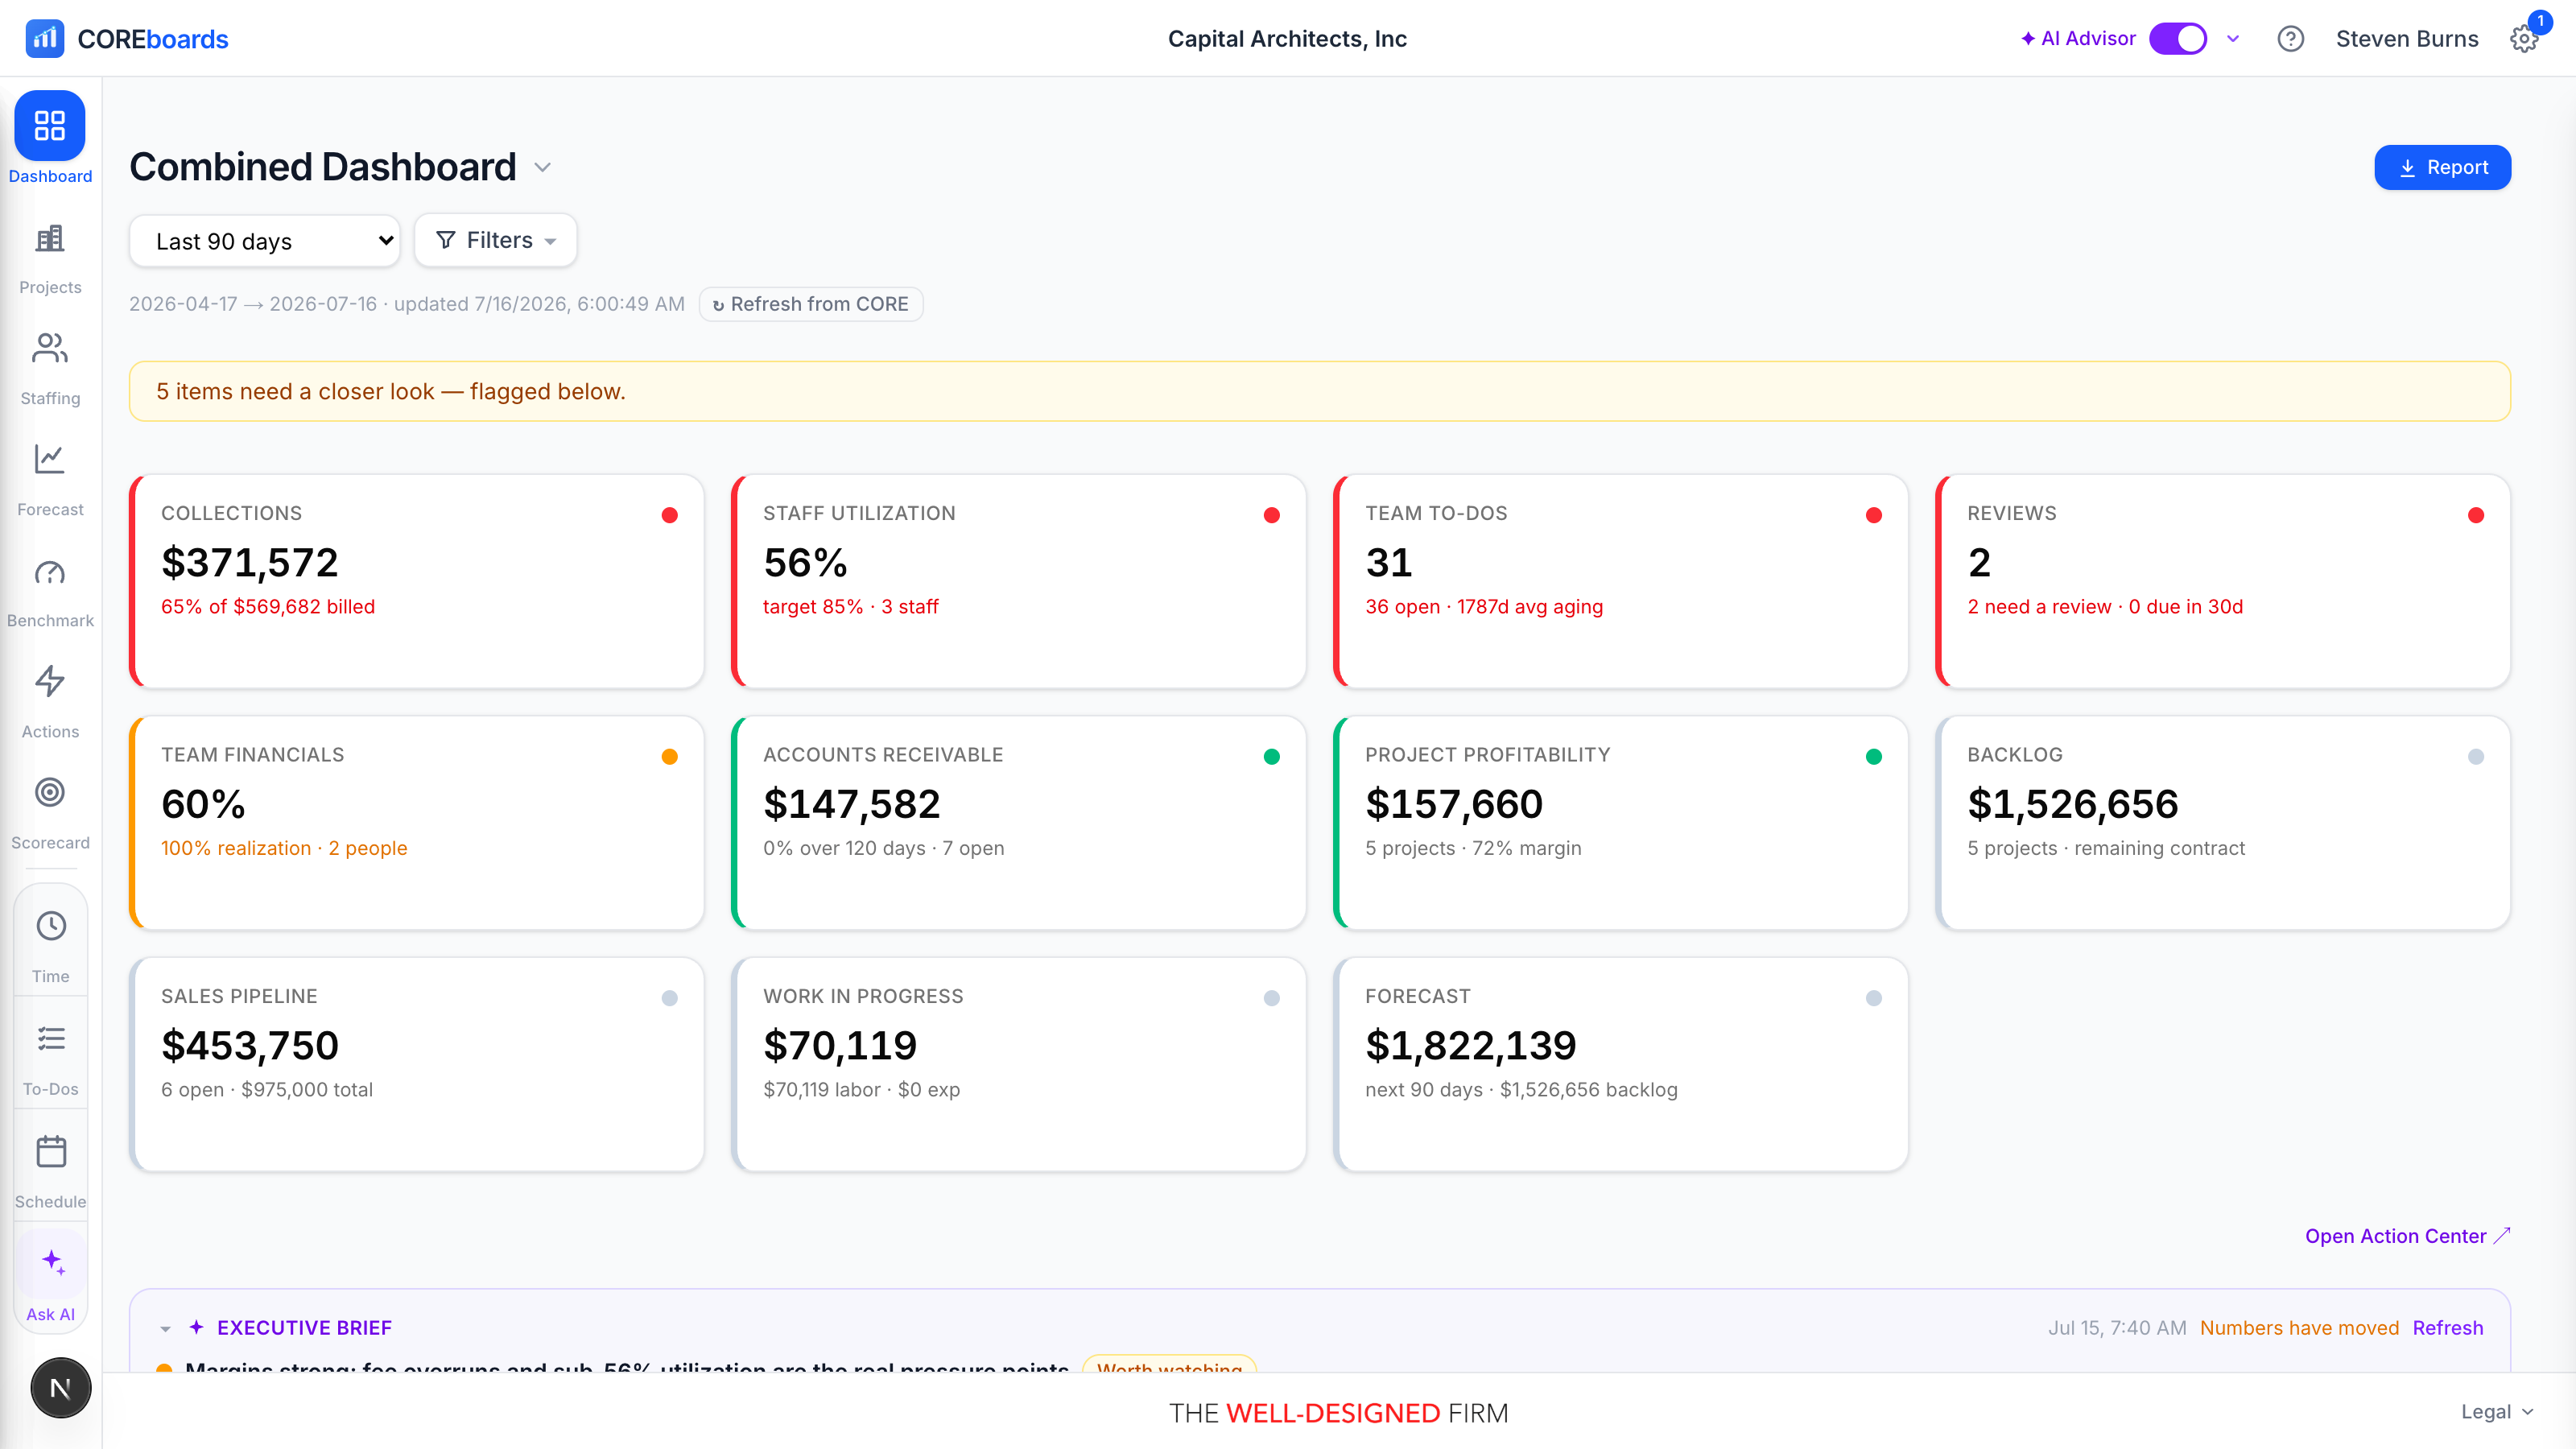
- Hold more than one role? The board title itself is the switcher: click it to pick a persona, or Combined to see every tile you're entitled to on one board. Your pick is remembered per firm, and the list at the top follows it.
- One role means no switcher: the title is simply your board's name.
- At the top, Needs you this week lists what is waiting on you, each with the button that deals with it; your tiles and panels follow. Fold it to one line, or move it below your KPIs. See Your dashboard for how it works.
- The date range, Filters, Sort and Customize apply to the KPIs and panels; the list at the top reads neither.
- A colored attention banner under the header counts the tiles flagged for a closer look, or reads all clear.
- Firms can rename boards: a firm admin can relabel any board (say, Principal Dashboard to Leadership), and the Architect / Engineer board can show each viewer's own name as the title.
Period, filters, and saved filters#
Two controls scope every number on the board: the date range and the Filters menu. Change either and all tiles, drill-downs, and the PDF report follow.
- Date range: pick from This week, Last week, This month, Last month, Last 30 days, Last 90 days, Trailing 12 months, Year to date, Last calendar year, or Custom range with your own start and end dates.
- Filters narrows everything to specific Principals, Project Managers, Projects, or Clients. The button shows the active filter's name so you always know when the board is scoped.
- Saved filters: save a combination you use often, and it appears at the top of the Filters menu. Star one as your default and it applies automatically when you sign in.
- Update a saved filter with your current picks, rename it, or delete it from the same list. Saved filters are private to you.
On a fresh sign-in the date range starts at Last 90 days even if you left the board on something else, so stale custom ranges never slow the first load. A saved filter you apply keeps its own dates: it's a deliberate saved view.
Customize the board#
✦ Customize (beside Filters) rearranges the board itself. Changes apply live behind the dialog, save per board and per Viewing as persona, and follow you across devices.
- Reorder: drag rows into your order, or nudge with the ▲▼ buttons (keyboard and touch).
- Hide anything you don't use with the eye toggle. The Hidden group at the bottom is how you bring things back — including dismissed ghost KPIs, which show the reason they were never live.
- Widths: panels and the Projects portal can be one column, two, or full width; KPI tiles are always one column.
- Reset returns the board to its persona default.
Drilling into a KPI#
Every tile answers a question, and clicking it opens the story behind the number: a detail panel slides in from the right while the tiles stay visible and clickable, so switching metrics is one click, not close-and-reopen.
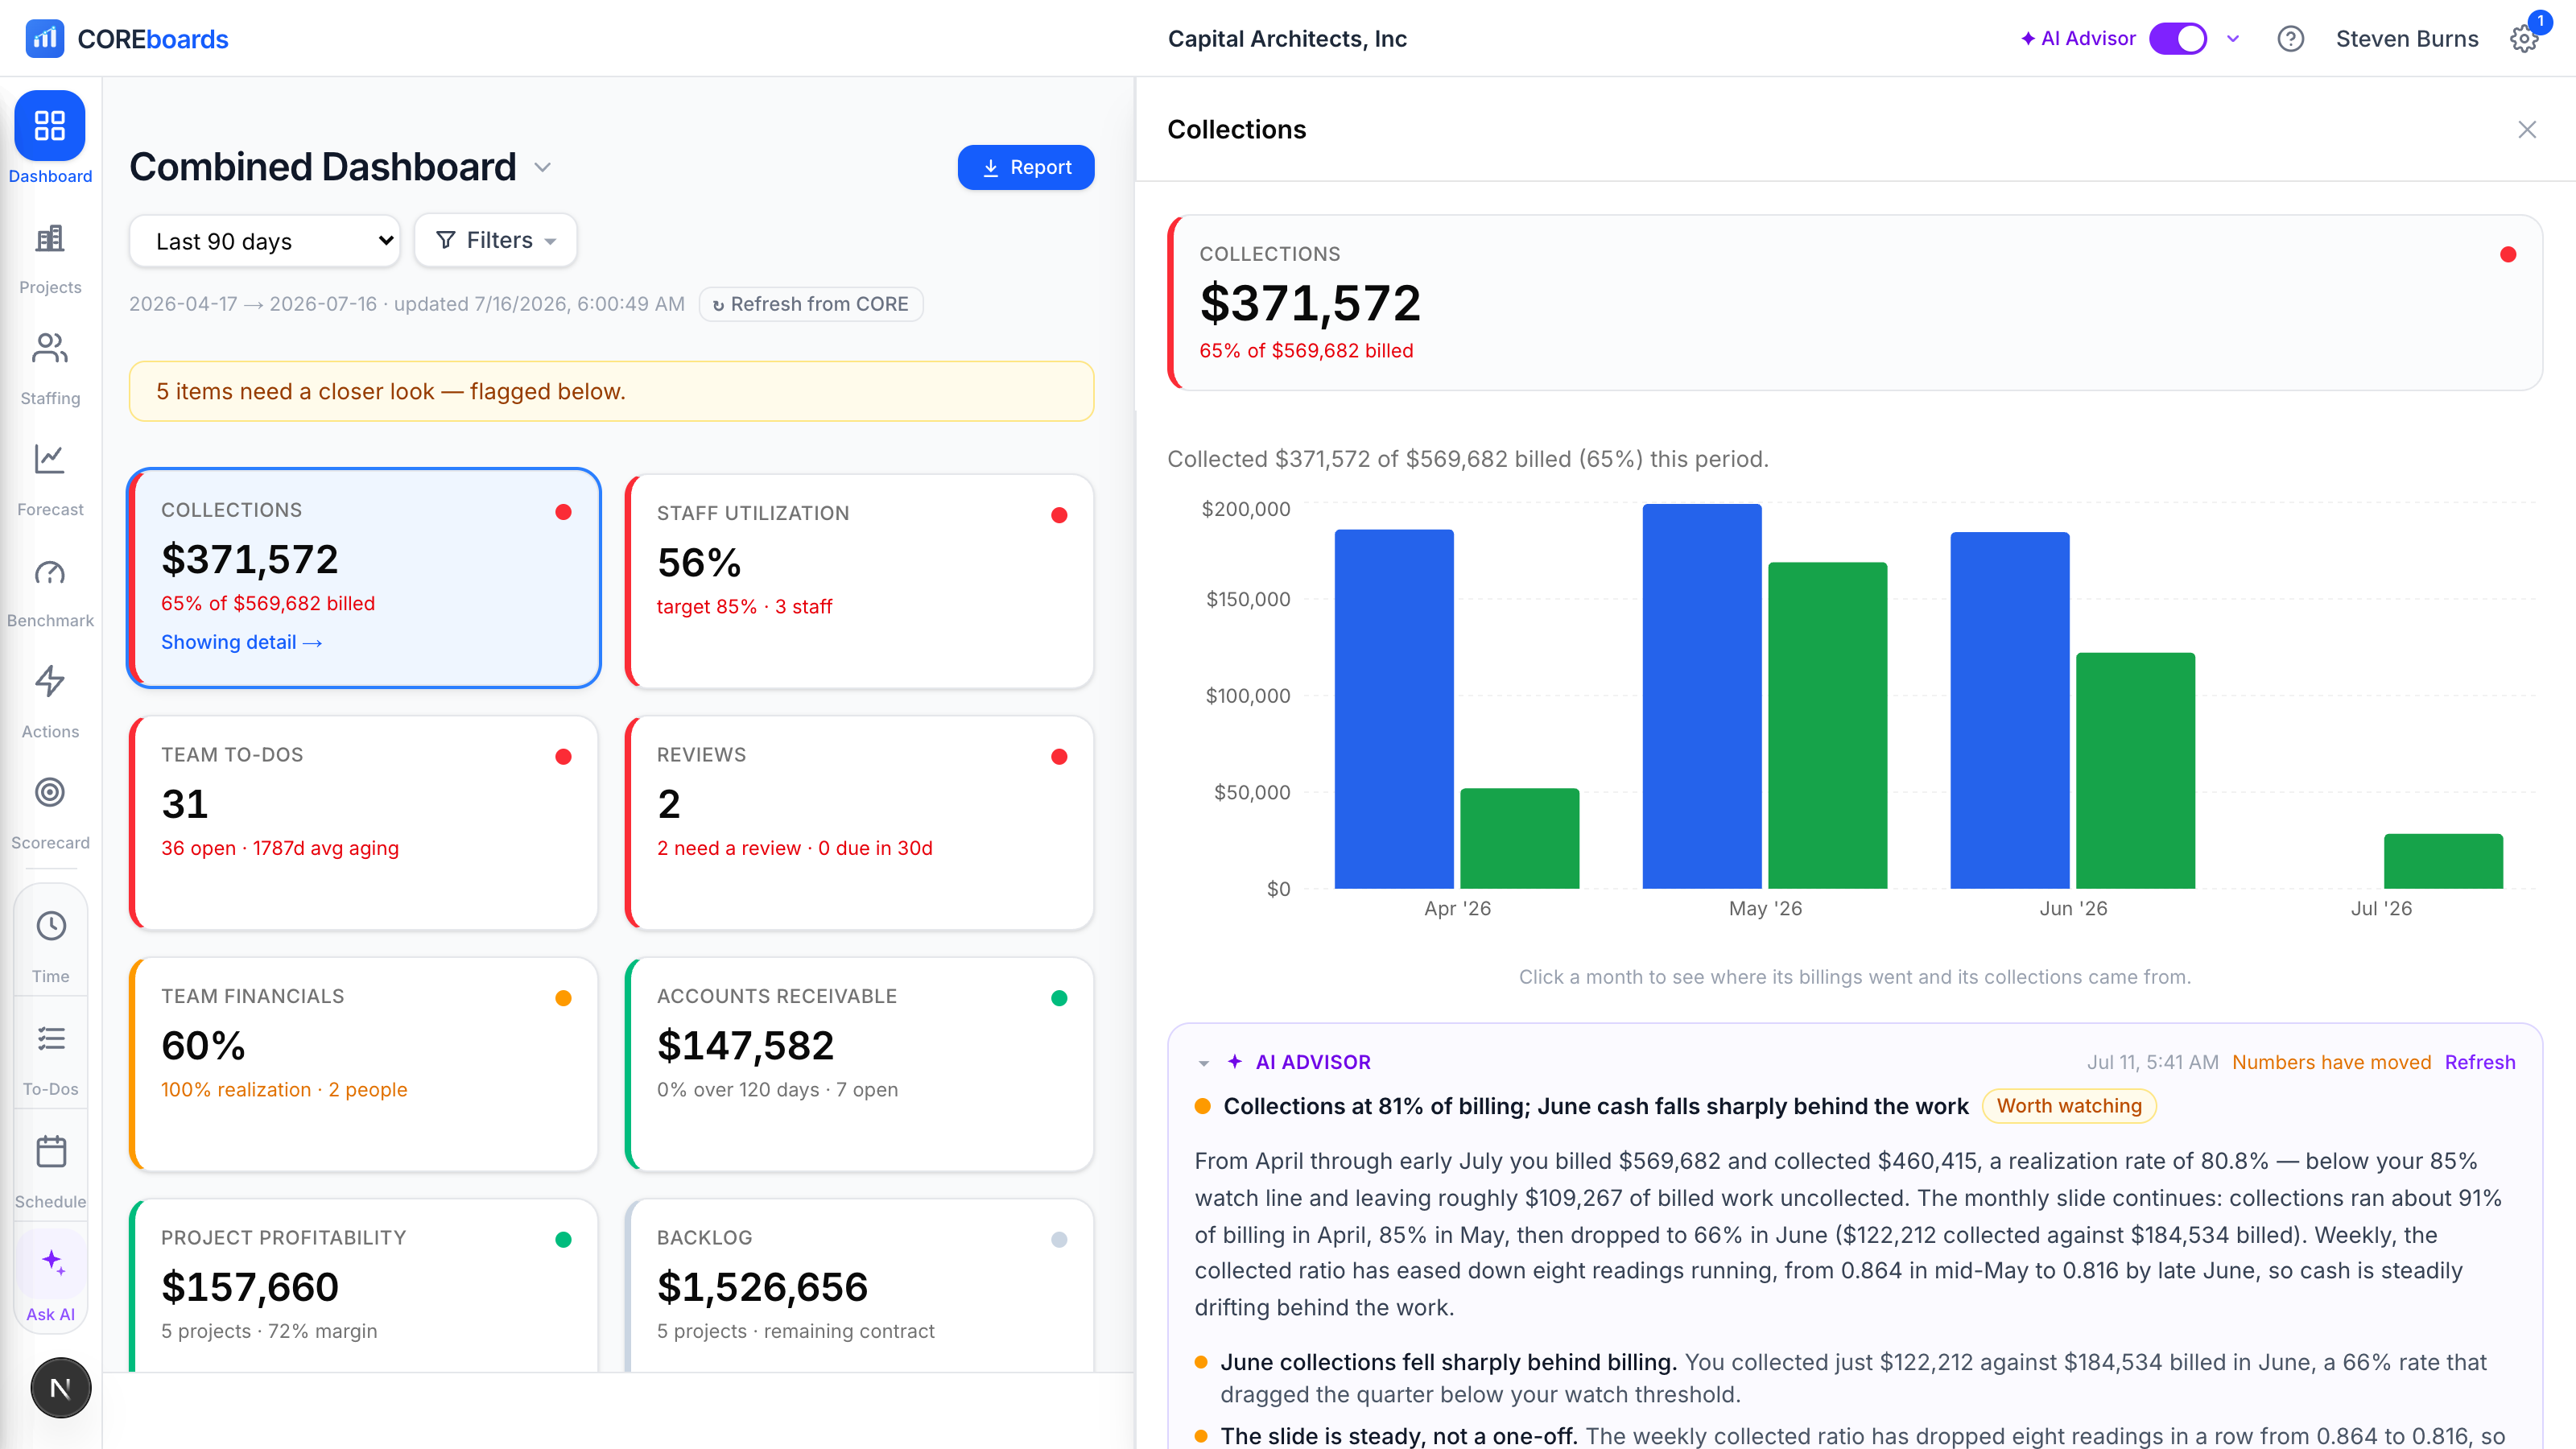
- Resize it: drag the panel's left edge to give a big table more room. The width sticks.
- Expand the tree: financial KPIs like Profitability and Backlog break down as a tree, contract type, then project, then its phases in CORE's own structure order. Expand a row to see its children; each row shows that node's own figure.
- Accrual vs Cash: the Profitability panel has a basis toggle. Accrual counts profit as the work is performed (the value of logged hours at bill rates minus cost, invoiced or not), the proper-accounting view and the one closest to BQE CORE. Cash counts only what's been billed minus cost.
- Open in CORE: projects, invoices, and other records deep-link straight to the same record in BQE CORE, in a new tab. If the link doesn't work, set your firm's CORE web address in Settings.
- Charts are interactive: hover for exact figures, and click a bar (for example a Collections month) to open that slice's own breakdown below the chart.
The AI layer#
With the AI Advisor on, the dashboard adds a written layer over the numbers: plain-language reads, findings, and suggested tasks. It analyzes only when the underlying data has changed; otherwise you're reading a stored result, so it's fast and never does the same work twice.
- The header switch (the ✦ AI Advisor control) is the master on/off. The chevron beside it opens per-module checkboxes, so you can keep the Advisor on the dashboard but off elsewhere, or the reverse. An off module shows no AI content and spends nothing.
- Executive Brief: a compact cross-KPI read above the activity feed: headline, health, and patterns. Each KPI's own suggestions are in its drill-down panel.
- Per-KPI insights: each KPI's drill-down panel carries its own Advisor read with findings and a task checklist. Check tasks off there, or push one to CORE as a to-do.
- A firm admin can turn the Advisor off for individual people; for them the control and all AI content disappear.
AI advice is a starting point, not an instruction: verify against the drill-down before acting on large decisions.
How fresh is this, and Refresh from CORE#
The fine print under the date controls shows the exact period the board covers and an updated timestamp: when COREboards last pulled your firm's data from BQE CORE.
- Data refreshes automatically about every 30 minutes, and sooner when CORE sends change notifications.
- Refresh from CORE forces a full re-pull right now: use it when you've just posted time or invoices in CORE and want them on the board immediately.
- If a refresh fails, the board keeps showing the last loaded data and says so; nothing blanks out.
The PDF report#
Download report (top right) produces a polished PDF of the board you're looking at: a cover page plus one page per KPI, with the chart, the breakdown, and the Advisor's stored read where one exists.
- The report captures the board exactly as filtered: current persona, date range, and filters at the moment you click.
- It's built for forwarding: send it to a partner meeting or a lender without giving anyone a login.
Why a tile is greyed out#
A muted tile under Add to your dashboard is a KPI your board could show but has no data source for yet. It's an invitation, not an error.
- Sales Pipeline ghosts when your firm's CORE subscription doesn't include the CRM module; the tile's link takes you to where to add it.
- Time-derived KPIs (utilization, WIP, staffing, realization) ghost when your CORE user has no active package that includes Time & Expense, so a billing-and-AR-only user still gets a working board.
- Connect the data source in BQE CORE and the tile comes to life on the next refresh; nothing to configure in COREboards.
Can't find it? Email support, or use Bugs & Requests in the app's gear menu.