
Help Center / Benchmark
Benchmark
Your firm's KPIs on gas gauges against BQE's annual industry survey. · 4 min read
How your firm compares#
Benchmark places your firm's KPIs against BQE's annual Benchmarking Report, one card per KPI. Your own value comes from CORE where it can be computed, and from two annual figures your firm enters for the profit-and-loss KPIs. The industry distribution behind each card is BQE's published survey data, matched to your discipline (Architecture or Engineering) and your employee-size band, taken from your active headcount in CORE, so you are compared against firms like yours.
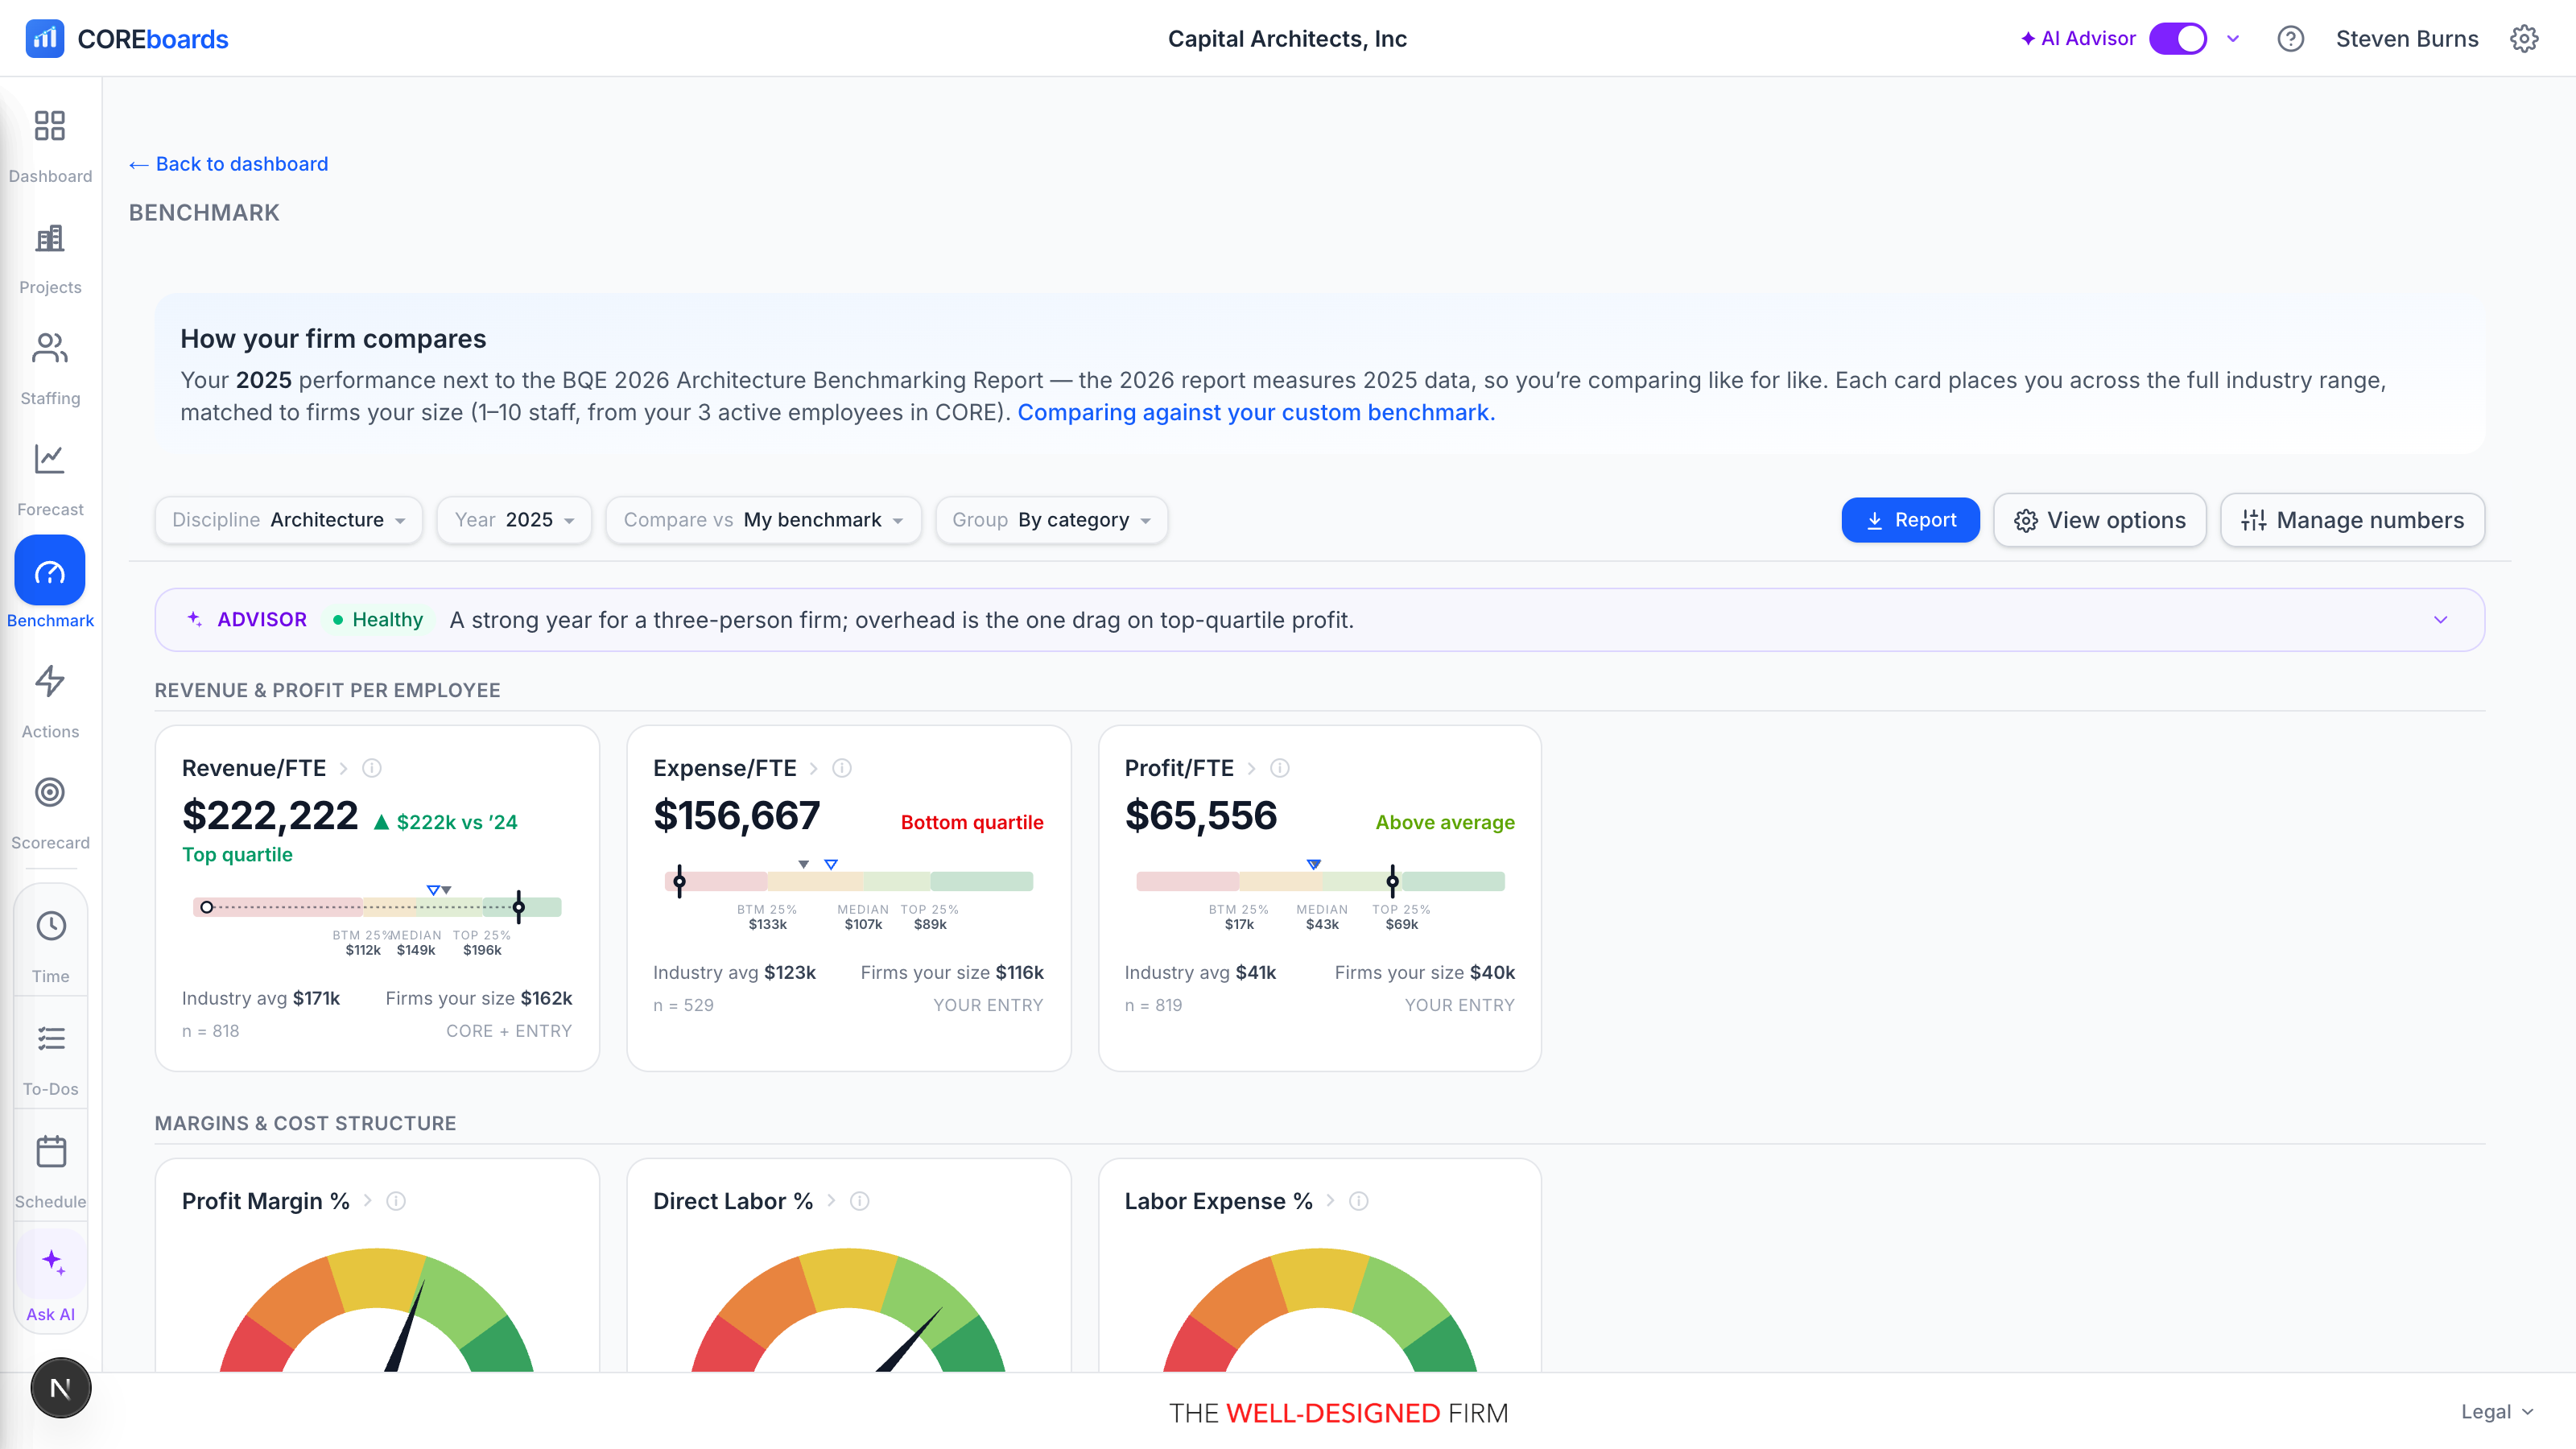
The years line up on purpose: the report published in one year measures the prior year's data, so your 2025 performance sits next to the survey that measured 2025. Viewing is open to everyone at the firm; editing the numbers is for leadership.
Reading a card#
Each card names the KPI, shows your value, and places it on the industry scale with a tier label: Bottom quartile, Below average, Above average, or Top quartile. Three graphics are available (pick per category in View options):
- Gauges: the classic red-to-green dial. The needle is your firm; the further right, the better you rank. Below it sit the industry's Bottom 25%, Median, and Top 25% figures.
- Benchmark strips: a compact scale with you, last year's you, the industry average, and the firms-your-size average on one line, with the quartile zones tinted behind.
- Trend panels: your last few years plotted against the industry's middle 50%, to show direction, not just position.
- A year-over-year chip shows how you moved since the prior year, direction-aware, so an improvement is always green even for lower-is-better KPIs.
Click any card for the full guide to that KPI: what it measures, how it is computed, and what the survey says about it. A card reading No industry data means the survey did not publish that KPI for your year; your own value still shows for reference.
Controls#
The control bar stays pinned while you scroll the cards.
- Discipline: Architecture or Engineering, whichever survey fits your firm.
- Year: the performance year to grade. Earlier years stay available as new reports arrive.
- Compare vs (editors only): BQE official, the published survey numbers, or My benchmark, your firm's own edited copy (see Custom benchmark below).
- Group: cards grouped by category, or one flat grid.
- View options: which categories show, which graphic each uses (strips, gauges, or trend panels), and which details render on cards: the quartile scale, industry average, firms-your-size average, prior year and YoY change, sample size, and the data source badge. Choices are per user and follow you across devices.
Manage numbers: your firm's annual figures#
Manage numbers (leadership: principals, CFOs, and firm admins) opens the data panel. The My firm's numbers tab holds your annual figures for the selected year. CORE pre-fills what it can from your invoices and timesheets, shown as placeholders; leave a field blank to accept CORE's value.
Two figures are the exception: Total expenses and Total labor cost. A completed year's operating expenses live on your Profit & Loss, wherever you keep your books, and CORE's API cannot hand them over, so your firm supplies them. They unlock Profit, the multipliers, and Labor Expense %. If you run your books in CORE, the link under each field opens CORE's Report Center to run the P&L for the right year.
Or upload the P&L
Faster: Upload P&L. Drop in the P&L as a PDF and the Advisor reads it and proposes the figures, telling you which line each came from. You review every number before anything saves, and the file itself is read once for the figures, not stored.
Custom benchmark#
The Custom benchmark tab lets your firm keep its own copy of the industry numbers: the average and the quartile figures (bottom 25%, median, top 25%) for every KPI, prefilled from the current baseline. Use it to fold in another survey you trust, your peer group's numbers, or internal stretch goals.
- Saving switches the board to Compare vs: My benchmark; flip back to BQE official any time, your copy is kept.
- Reset to defaults discards the copy and returns to BQE's published numbers (it asks first).
When the custom copy is active, the board header says so, so nobody mistakes house numbers for the survey.
Report and export#
The Report button builds a shareable PDF: a cover plus a page per KPI group, with the survey's guidance alongside your positions. A CSV export carries the same numbers into a spreadsheet. When BQE's original published report is available for your year and discipline, it is offered as a separate download in the same menu, so the source document is always in reach.
Can't find it? Email support, or use Bugs & Requests in the app's gear menu.